
Tags
animals, Genetically modified food, Genetically modified maize, GMO, Monsanto, Popular science, Roundup, science, science and society, Science communication, Science in Society, Statistics
There’s been a great furor recently about a study which purports to show that rats fed GM corn develop more tumors than rats fed regular corn. I’m actually a bit late to this party; scientists and science writers across the web have already picked apart the flaws in this study, from shoddy statistics to poor design, and Carl Zimmer has called the whole thing “a rancid, corrupt way to report about science“. I don’t have much to add to the chorus; what I’d like to do with this post is to make clear to the layperson what we mean by “bad statistics” and why that makes the study unconvincing.
In case you haven’t heard about this study, I’ll provide a quick summary. The aim was to assess the long-term impact of genetically modified (GM) food; to do this, the research fed rats a diet with and without GM corn over their entire life (2 years) rather than the shorter period (90 days) used in previous studies. The GM corn used was engineered by Monsanto to be resistant to the herbicide Roundup, so the researchers also tested the effect of diet of GM corn which had been sprayed with Roundup. The rats being fed GM corn were further divided into three groups, one with a low dose of GM corn (11% of the corn in their food), a medium dose (22%) and a high dose (33%). The researchers monitored the health of the rats in various ways, including blood and urine tests and regularly checking for tumors. Their main finding was that the GM-fed rats died earlier and had more tumors (and other health problems) than the rats fed regular corn (the “control” rats).
I was intrigued when I heard about this study. I read the paper without any particular hostility to the idea. While reading, though, I was quite surprised when I realized that the team had used only 20 rats (10 of each sex) in each group. I’m not a statistician, but based on my experience as an evolutionary biologist that struck me as too low a number to be able to make any strong conclusions, especially when there were so many different treatment groups. It just seemed like the study had been too ambitious. I was also concerned because the study wasn’t double-blind, a practice I was trained to consider de rigueur in such studies. These doubts were enough to prompt a search to see what others had said. My misgivings were confirmed when I came across a post by Andrew Kniss at Control Freaks, where he elegantly demonstrates the problems with using so few rats.
I’m not going to go into the argument in depth but rather try to make it accessible to the lay reader. Basically, when you do an experiment you’re trying to test an idea you have about the world — a hypothesis. You design an experiment and then gather some observations. The crucial issue is whether your observations — the results — actually support the hypothesis or if they could just be due to dumb luck. For example, I might claim that I could predict if a coin would come down heads or tails. If I tried to convince you by flipping a coin once and guessing correctly, you’d be underwhelmed by my argument (and rightly so). On the other hand, if I could guess correctly 5, 10 or 15 times in a row, you might start to wonder. That intuition is the crux of statistics and what we mean when say that results are “statistically significant” — could it be that they just happen to look right by chance? Statistics is how we can formally, accurately and quantitatively answer that question.
Of course, science experiments are usually much more complicated than flipping a coin, so the statistical analysis is more complicated. The basic idea, however, remains the same. Just like in the example of flipping a coin, it’s important to repeat tests and do them on large groups so we can be sure that the results aren’t just due to luck. That’s what this study failed to do. In his post, Andrew Kniss claims that it’s possible to randomly pick several groups of 10 rats and get results similar to the study even without treating the rats differently. In fact, he doesn’t just claim so — he provides computer code to demonstrate his point. Since the argument might be a bit technical for some folks to follow, I decided to use his code and present the results graphically to help make the point clear. The article presents lots of health-related data, but for simplicity’s sake (and because the data aren’t entirely clear) I’m going to focus on the part that seems to have gotten the most attention: the tumors in female rats. The other data suffer from the same problem; the fact that the rats were sick in lots of ways doesn’t make much difference since those aren’t independent observations — rats that develop one problem might be likely to develop others, too.
Basically, I told the computer to make a population of rats which each have a certain chance of getting a tumor. Then I simulate the experiment by randomly creating seven groups (no GM corn, three doses of GM corn, three doses of GM corn plus Roundup) from this population, each with ten rats. The crucial thing is that, since this is a computer simulation, we know that there is absolutely no difference between the seven groups. I’ve labeled them the same way as in the experiment to make things look similar, but in fact the seven groups in the simulation are identical in every way, so any patterns cannot be due to the effect of GMO food (or anything else). I repeated this simulated experiment 10 times and made graphs from the resulting data. Here’s how the data from the real experiment (in green) compare with the simulation results (in blue):
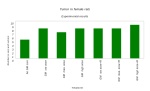
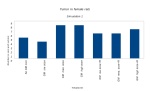
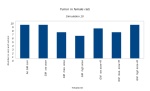
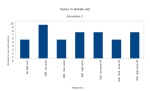
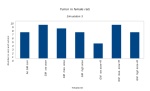
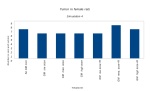
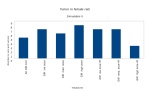
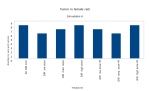
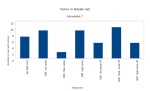
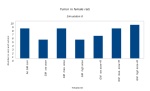
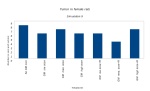
The point isn’t that any of these graphs are exactly the same as the data from the experiment. Rather, the point is to show that those results aren’t particularly exceptional. In four of the simulations (#1, #2, #3, #5), the control rats have fewer tumors than most of the GMO-fed rats. Again, this is what we would observe even if there was absolutely no difference between the “treatments”. In general, there’s enough variability that we can’t say for sure that the actual results aren’t simply due to chance — that is, that they’re significant. The experiment uses too few rats to be able to make any conclusions. In fact, I was struck by the fact that the paper doesn’t seem to make any claims that the results are significant, which is something that would normally be done in this kind of study. Perhaps they thought the results obviously supported their hypothesis. If so, they were wrong.
Does this mean that eating GM food won’t cause tumors? No, that’s absolutely not what it means. All it means is that this experiment wasn’t good enough to tell us anything about the relationship between GM food and tumors. In my opinion, GM foods should be no more unsafe than other foods; however, I do have a distrust of large corporations like Monsanto and I think regulatory capture is a real and very troubling problem. If there really haven’t been any studies on the long-term effects of GM food, I think they should be conducted. Unfortunately, though, this paper hasn’t added very much to the debate. As sensational as it might seem, it hasn’t actually advanced our scientific knowledge of the effect of GMOs. It has, however, provided a powerful rallying point for partisans on both sides of the argument.
Refs
Andrew Kniss on Control Freaks: Why I think the Seralini GM feeding trial is bogus
Séralini GE, Clair E, Mesnage R, Gress S, Defarge N, Malatesta M, Hennequin D, & de Vendômois JS (2012). Long term toxicity of a Roundup herbicide and a Roundup-tolerant genetically modified maize. Food and chemical toxicology : an international journal published for the British Industrial Biological Research Association DOI: 10.1016/j.fct.2012.08.005
The R code I used and the output.

Pingback: Control Freaks » Blog Archive » Why I think the Seralini GM feeding trial is bogus
Pingback: Control Freaks » Blog Archive » Why I think the Seralini GM feeding … | feeding
Why do you think the journal would accept such a paper? Also as a researcher being interviewed for the news stories (I hope that happened) wouldn’t you always state that the results were maybe interesting at best but to be conclusive would have to be run with a larger sample size? Who would fund such a project from the beginning, knowing all these things? Did the researchers know better? Anyway…lots of questions but thanks for taking the time to do some fact checking! Thanks for the plots, might be interesting to change probabilities over groups and leave sample size small to show how it would still look the same and then also show how over large samples how the differences start to show.
Those are excellent questions and I won’t claim to have answers to all of them. I don’t know how the paper got accepted by the journal — I honestly think it shouldn’t have made it past a proper peer review. The fact that a study with such supposedly dramatic results was published in Food and Chemical Toxicology instead of a more prestigious journal may be indicative of something.
I refrained from speculating about the researchers’ motivations or excoriating their behaviour in my post because I wanted to stick to the science, but the way they handled the entire affair has been questionable at best. They called a massive press conference on the day the paper was published, which should set off alarm bells since it’s a bit unusual in science. Reporters who were given early access to the paper were made to sign an NDA, which is also very strange behaviour. On top of that, I’ve read that the lead author, Seralini, released a book and a film about GMOs the same week (entitled “Tous Cobayes?” (“Are we all guinea pigs?”)). Honestly, the whole thing stinks…I just didn’t want to get into that in the post itself. 🙂
Pingback: Things You’ll Find Interesting October 11, 2012 | Chuq Von Rospach, Photographer and Author
Pingback: מדעי השיווק: תירס מהונדס גנטית והסכנה שלא היתה « SciPhile
It has been noted elsewhere by others that the controls in the Seralini 2012 paper had a lower incidence of tumors than the average which would be expected for the breed. This, of course, would not be unusual because it would be expected to happen relatively often by chance alone. That is, if you repeated this experiment many times you would find that, just as shown in your simulation, sometimes the controls would show a larger number of tumors than expected (a bit less than half the time) and sometimes the controls would show a smaller number of tumors than expected (a bit less than half the time). Similarly, if I conducted many trials of 10 coin flips I would *not* expect to get 5 heads and 5 tails most of the time.
Given that we are only dealing with 10 rats, the normal variation produces larger statistical noise than what we would otherwise see with a larger control group. That is, you would still have the statistical variation with, for example, 100 rats but this variation should be much smaller relative to the size of the group with 100 rats. Similarly, you would see a difference in the pattern produced by coin flipping trials of 10 coin flips versus the pattern produced by trials of 100 coin flips. In the former case, the probability of deviating from the average by 10% or more (6 or more heads & 4 or fewer tails or 4 or fewer heads & 6 or more tails) is 75% (with a surprisingly large 35% probability of deviating by 20% or more) whereas with trials of 100 coin flips the probability of deviating by 10% or more is a mere 5.8% (with a minuscule 0.01% probability of deviating by 20% or more)*.
Another way of looking at it is that, because each rat represents such a big jump for a group size of 10, large deviations from whatever the average cancer rate is for these rats are to be expected.
Now that we have seen that both significantly larger & smaller than average tumor incidences are to be expected for a small group size, the issue that is produced by the smaller than average tumor incidence in the controls is that the controls are (very properly) what the treatment groups are compared to and that this artificially inflates the treatment effect in apparently inducing tumors. The opposite is also the case. If, by chance, the small control group happened to develop more tumors than the average for the breed, it would artificially inflate the treatment effect in apparently protecting against tumor development. Both scenarios can be seen in your simulations. Combine this with uncorrected multiple comparisons (which pretty much guarantee finding some effect) and we get absolutely meaningless results.
* These coin flip numbers are empirical as I too ran some simulations (even though they might be easily calculated –though I have not given it any real though so I might be wrong).
Thanks for your thoughtful comment! Statistics and the problems associated with things like variation & population size aren’t intuitive for many people, so it’s great to present the ideas in different ways and have more examples.